Product strategy · Experience design
Proofpoint.
Building better security habits.
- Product strategy
- Behavioral design
- Rollout leadership
- Customer organizations on ZenGuide
- 6,000+
- End users on the platform
- 58M+
- Customers on the new dashboard by end of 2025
- >90%
- Lower median phishing-simulation click rate at companies with a “Live One” badge earner
- 64%
The challenge
As Senior Product Manager for ZenGuide’s Learner Experience team, I led the development and rollout of a new Learner Dashboard for a security awareness platform serving more than 6,000 customers and 58 million end users.
The opportunity went beyond making training easier to complete. I wanted to give learners a reason to participate, help them understand their progress, and reinforce the security behaviors our customers needed.
Making the score understandable
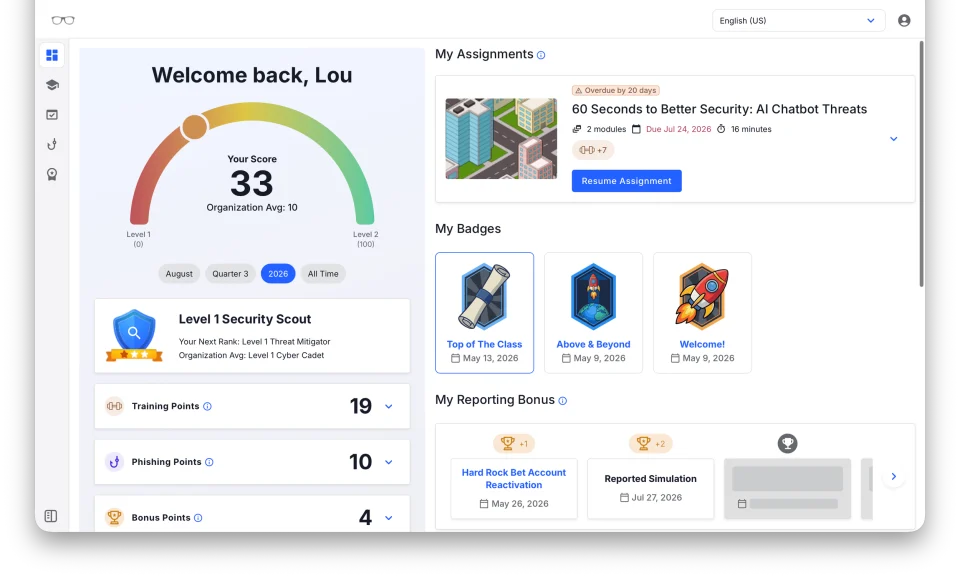
We began discovery in Fall 2024 and launched Early Access in Spring 2025. That first version included a risk-based Security Score from 0–100. It combined training completion, phishing simulation reporting and click rates, and how frequently a learner was targeted by malicious threats.
The score brought several signals together, but early feedback exposed a problem: learners couldn’t explain it. Why was their score 84 or 74? Why didn’t completing a training module change it?
I rethought what the score needed to do for the person looking at it. If we wanted it to motivate action, learners needed to understand the relationship between what they did and the progress they earned.
Before General Availability, we replaced the risk-based calculation with a transparent, action-based points system. Learners could see what an action was worth before taking it, then see that contribution reflected in their score. Ranks and levels gave those points a sense of progression and offered attainable goals along the way.
That changed the role of the Security Score. It became a way for learners to understand and build on their participation.
Encouraging better habits
Security awareness training often centers on mistakes. A learner receives a simulated phishing email, clicks a bad link, and gets corrective feedback. We wanted the Learner Dashboard to feel positive and encouraging.
We used the Octalysis framework in internal workshops to explore learner motivation, emphasizing its “white hat” techniques around achievement, empowerment, and meaning. The challenge was translating those principles into mechanics that fit security training.
Phishing streaks became one example as we continued developing the experience in 2026. We wanted to recognize people who consistently reported simulations successfully, while giving someone who clicked a reason to keep participating.
We designed a bonus that increased with each consecutive simulation a learner reported. Missing a report or clicking a simulated phishing link reset the streak, but it did not remove points already earned. Consistent performers could build higher scores through increasing bonuses, and a mistake did not erase someone’s previous progress.
Badges extended that recognition to specific achievements. The “Live One” badge, for example, rewarded reporting an actual malicious email, connecting the experience to behavior that mattered outside a training exercise.
Giving everyone a new season
An accumulating score introduces another product question: how do you keep it meaningful over time?
I designed the Security Score as an annual metric, with the calendar year as its default view. Like a sports team starting a new season, learners would have a fresh opportunity to establish their record.
The intent was to give strong performers a reason to stay engaged and struggling learners a chance to start again. Within the year, earned points only went up. At the start of a new year, everyone began a new scoring period.
Historical progress remained available through an All Time view. Learners could see their longer-term achievements while keeping the current year’s goals within reach.
Learner Dashboard
Building for a different scale
The learner experience also had different technical needs from ZenGuide’s administrative tools. Thousands of customer organizations translated into tens of millions of potential end users.
I encouraged the development team to build the Learner Dashboard separately from the Admin architecture where practical. The difference in scale was one reason; another was giving the learner team more flexibility to improve the experience.
The resulting architecture allowed us to ship learner updates independently of Admin releases. Working on a more modern technology stack also made iterative updates easier, giving the team a better foundation for responding to feedback after launch.
My role was to advocate for those product needs and work with engineering on an approach that supported them.
Making the transition deliberate
Shipping the dashboard was only part of the launch. We also needed to move existing customers and their learners into the new experience.
I led a staged rollout that balanced adoption with customer control. During Early Access, customers could choose to enable the Learner Dashboard for their end users. That gave us feedback from organizations actively trying the experience before we expanded its reach.
Once adoption reached approximately 10% and we had solid feedback, we announced the next step: the Learner Dashboard would become the default experience in 90 days. Customers who weren’t ready could explicitly opt out.
We communicated the transition over several months so customers had time to prepare and make that choice. Following General Availability in Fall 2025, more than 90% of customers had adopted the new dashboard by the end of the year, without major migration issues.
The rollout strategy was part of the product work. It gave us a path from voluntary early adoption to broad availability while leaving customers room to manage the change.
What we learned
Adoption showed that we could successfully introduce the new learner experience at scale. We also wanted evidence that engagement with its rewards was associated with stronger security behavior.
In June 2026, across ZenGuide customers, companies with at least one learner who had earned the “Live One” badge had a 64% lower median click rate in phishing simulations than companies where no learner had earned it.
That was correlation rather than proof of causation. It did not establish that the dashboard or badge caused the difference. It was an encouraging signal that organizations participating in the real-world security behaviors we rewarded were also showing stronger phishing resilience.
The clearest lesson for me came from the early score feedback: a metric can combine useful information and still fail to help someone decide what to do next. Making progress understandable became a guiding principle for the experience—from visible point values to streak bonuses and annual goals. The architecture and rollout decisions helped us deliver that experience, learn from it, and continue improving it.